This guide walks you through installing Gudu SQL Omni, running your first analysis, and exploring every major feature. You should be seeing real results within five minutes.
1. Installation
Open the Extensions sidebar in VS Code (Ctrl+Shift+X / Cmd+Shift+X).
Search for Gudu SQL Omni.
Click Install.
That is it. The extension ships with a bundled Java runtime, so you do not need to install Java or configure any paths. Gudu SQL Omni activates automatically whenever you open a .sql file.
2. Your First 5 Minutes
Open or create any .sql file to get started. The examples below use a simple query, but the extension supports 34 database dialects out of the box.
Set Your Database Dialect Free
What this does: Tells the parser which SQL dialect to use so it can parse vendor-specific syntax correctly.
Why you'd use it: If you write PostgreSQL, BigQuery, or Snowflake SQL, setting the dialect avoids false validation errors.
How to do it:
Open the Command Palette (Ctrl+Shift+P / Cmd+Shift+P).
Type GSP: Set Default DB Vendor and select it.
Pick your database from the list (Oracle, MySQL, PostgreSQL, SQL Server, BigQuery, Snowflake, and 28 more).
The extension also auto-detects dialects, so if you skip this step it will still try to parse your SQL correctly.
Validate SQL FreeCtrl+Shift+V / Cmd+Shift+V
What this does: Parses your SQL and reports syntax errors with line and column positions.
Why you'd use it: Catch syntax mistakes before you run a query against a live database.
How to do it:
Open a .sql file with one or more SQL statements.
Press Ctrl+Shift+V (Windows/Linux) or Cmd+Shift+V (macOS).
Check the Problems panel for any errors. Clean SQL shows a success notification.
Extract Tables and Columns FreeCtrl+Shift+E / Cmd+Shift+E
What this does: Identifies every table and column referenced in your SQL, including those inside CTEs, subqueries, and table-valued functions.
Why you'd use it: Quickly inventory what a complex query touches without reading it line by line.
How to do it:
Open a .sql file.
Press Ctrl+Shift+E (Windows/Linux) or Cmd+Shift+E (macOS).
The SQL Structure tree view appears in the sidebar, listing every table with its columns and data types.
The tree view lists every table and column referenced in the active SQL file.
3. Data Lineage Analysis
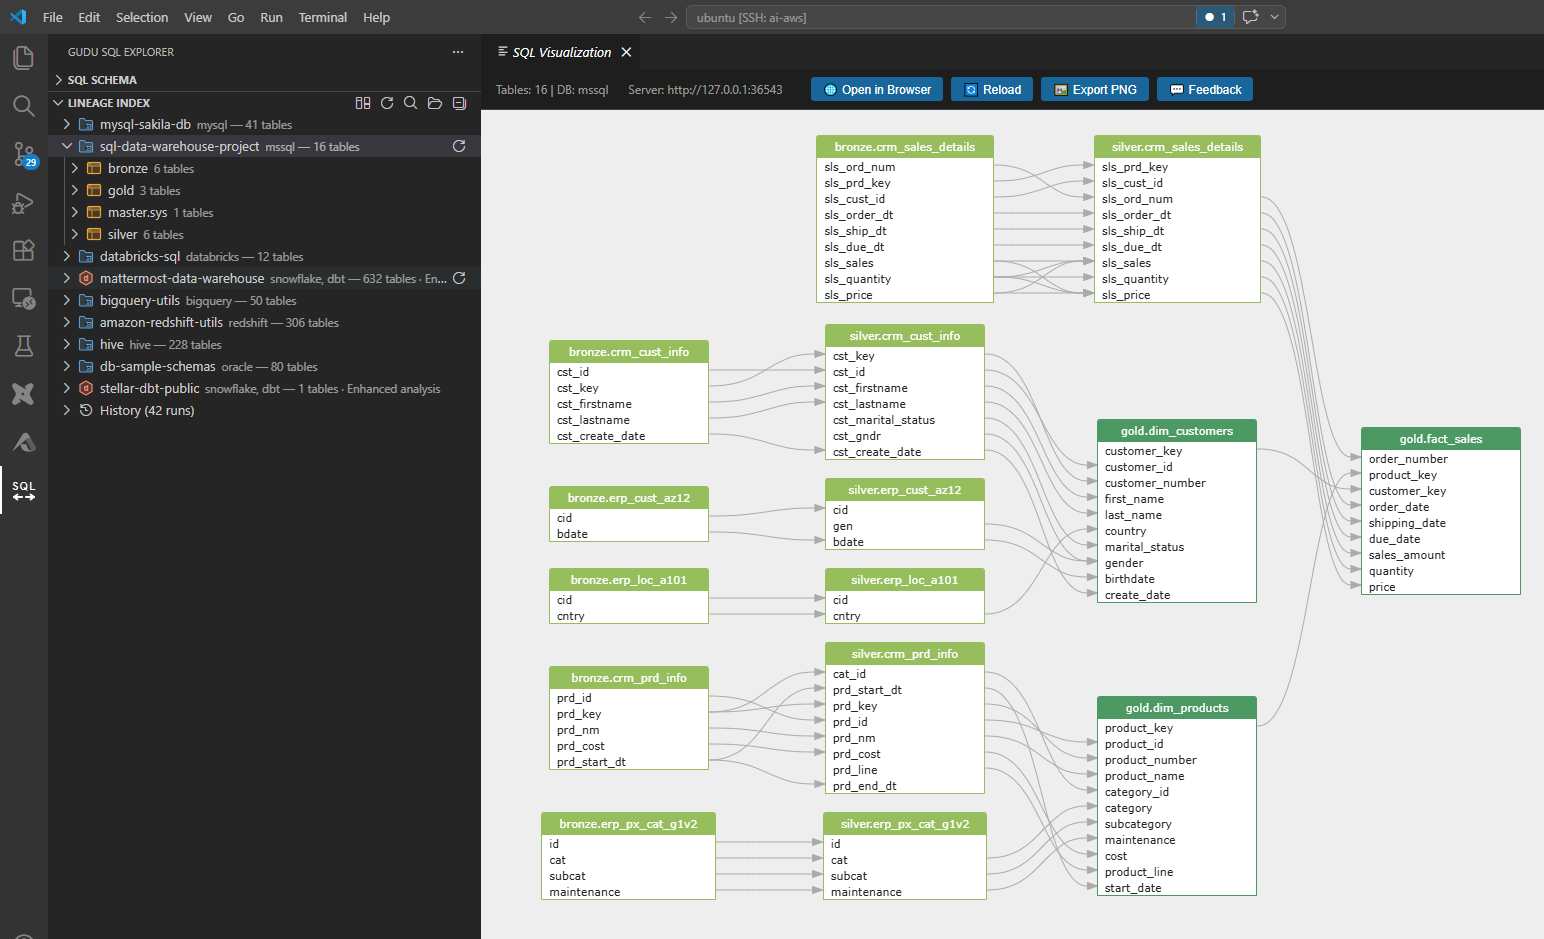
Data lineage is the flagship feature. It traces how data moves from source columns through transformations to target columns.
Column-Level Lineage ProCtrl+Alt+L / Cmd+Alt+L
What this does: Generates an interactive graph showing column-level data flow for the SQL in your editor.
Why you'd use it: Understand which source columns feed into each output column -- essential for debugging transformations, impact analysis, and compliance.
How to do it:
Open a .sql file containing one or more SELECT, INSERT, or CREATE statements.
Press Ctrl+Alt+L (Windows/Linux) or Cmd+Alt+L (macOS).
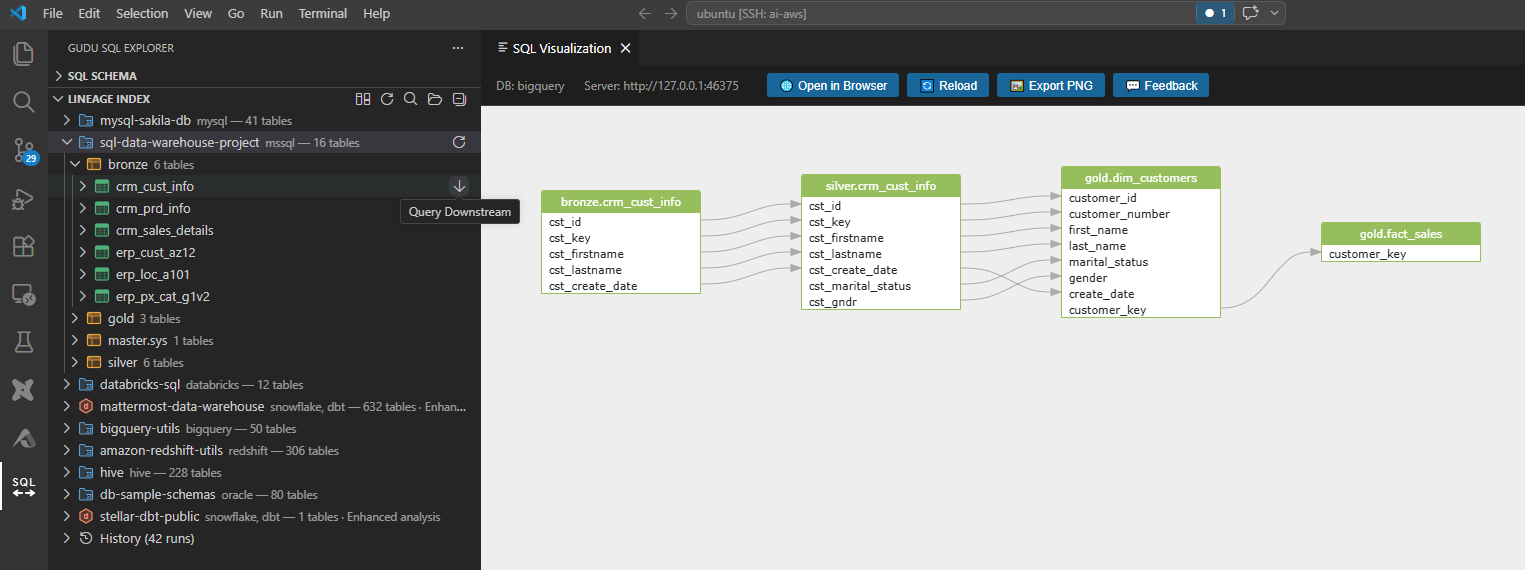
A webview panel opens with an interactive lineage diagram. Click any node to see details, or double-click to jump to the source SQL.
Each edge traces a data dependency from source column to target column.
You can export the diagram as a PNG using the save button in the graph toolbar.
Configure Lineage Options Ctrl+Alt+O / Cmd+Alt+O
What this does: Opens a panel where you can fine-tune lineage behavior.
Why you'd use it: Control whether intermediate/temporary results appear, toggle restrict/group relations, and set query depth (1-20).
How to do it:
Press Ctrl+Alt+O (Windows/Linux) or Cmd+Alt+O (macOS).
Adjust the settings: show temporary results, show restrict/group relations, query depth.
Re-run the lineage command to see updated results.
4. ER Diagrams
ER Diagram Pro
What this does: Generates an entity-relationship diagram from CREATE TABLE and DDL statements.
Why you'd use it: Visualize your database schema and table relationships without a separate diagramming tool.
How to do it:
Open a .sql file containing CREATE TABLE statements (or any DDL).
Open the Command Palette (Ctrl+Shift+P / Cmd+Shift+P).
Type GSP: ER Diagram and select it.
An interactive ER diagram appears in a webview panel.
You can export ER diagrams as PNG using the save button.
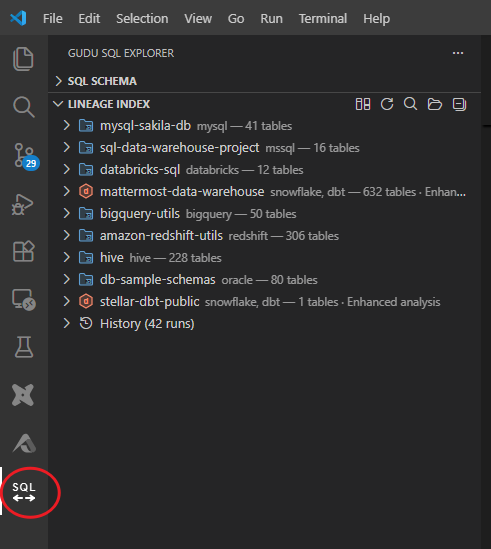
5. The Gudu SQL Explorer Sidebar
The Gudu SQL Explorer lives in the Activity Bar and provides three panels for working with SQL across your entire workspace.
The sidebar shows scan roots, tables, and lineage results.
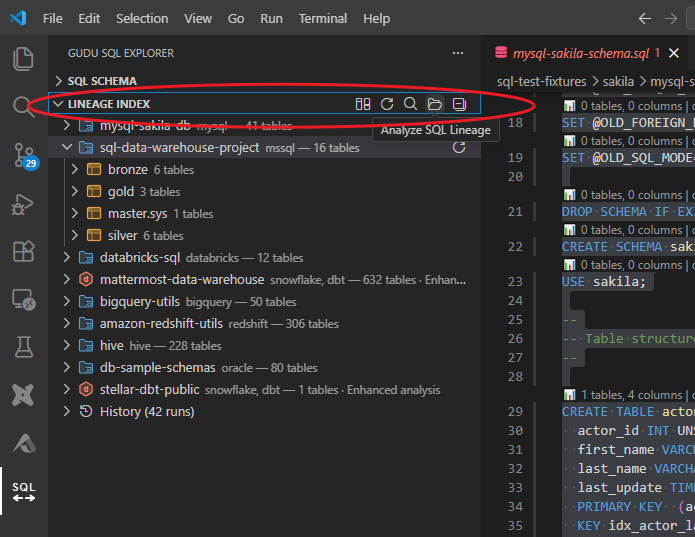
Lineage Index Panel
This is your home base for workspace-wide lineage. It lists every directory you have scanned, the tables discovered, and lets you query upstream and downstream dependencies.
Toolbar Actions
The toolbar provides quick access to scan, refresh, and visualization actions.
The toolbar at the top of the Lineage Index panel gives you one-click access to:
Scan Directory -- add a new scan root
Refresh -- re-scan existing roots
Visualize -- open the lineage graph for the selected item
6. Workspace Scanning
Workspace scanning analyzes all SQL files in a directory tree, builds a lineage index, and lets you explore cross-file data dependencies.
Scan a Directory
What this does: Recursively finds all .sql files in a directory, parses them, and builds a unified lineage index.
Why you'd use it: Understand data flow across an entire project, not just a single file.
How to do it:
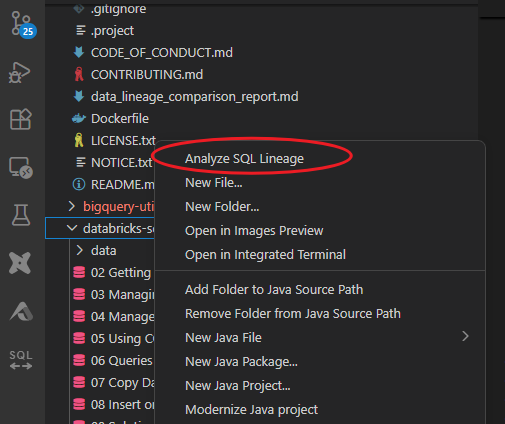
In the VS Code Explorer, right-click any folder.
Select GSP: Analyze SQL Lineage.
Wait for the scan to complete. A progress notification shows the status.
Right-click any folder in the Explorer to start a lineage scan.
Explore Scan Results
After scanning, the Lineage Index panel populates with your scan roots and discovered tables. Expand any scan root to browse the tables and columns found.
Visualize Lineage from Scan Results
How to do it:
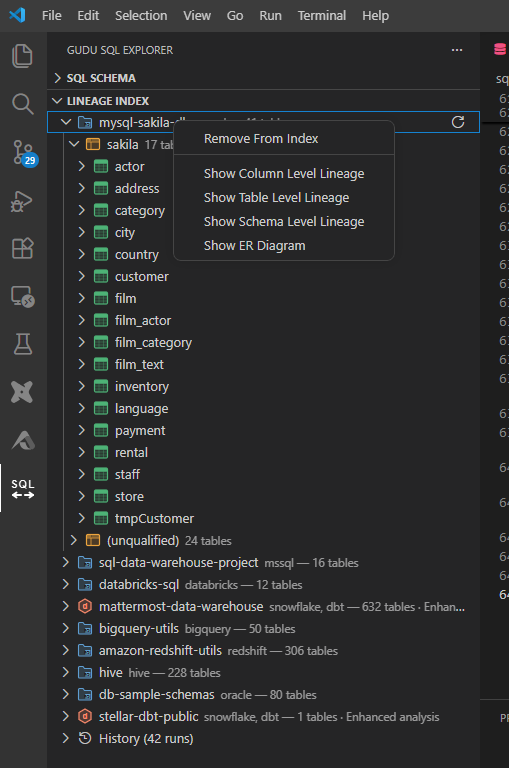
In the Lineage Index panel, right-click a scan root or table.
Choose a visualization option from the context menu.
Right-click a scan root to access visualization and export options.
Query Upstream and Downstream
What this does: Starting from any table or column, traces all upstream sources or downstream consumers across your scanned SQL files.
Why you'd use it: Answer "where does this data come from?" or "what breaks if I change this column?"
How to do it:
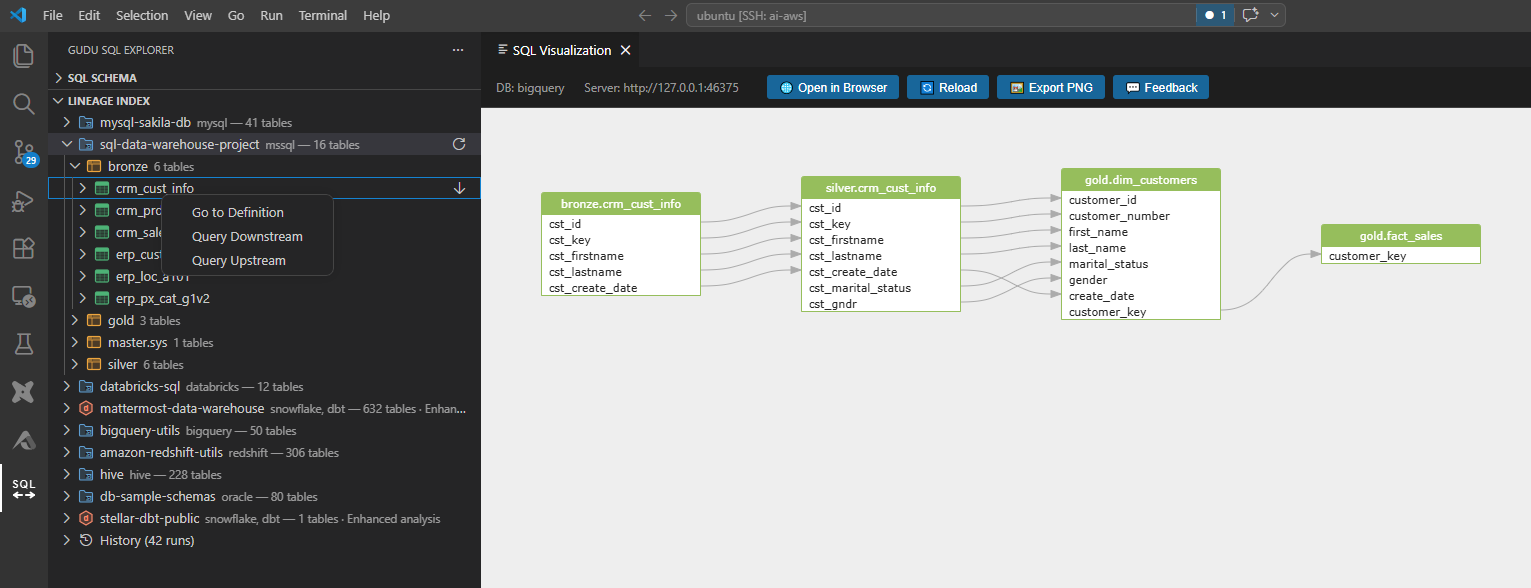
In the Lineage Index panel, right-click a table or column.
Select Query Upstream or Query Downstream.
Results appear in a dedicated results panel.
Query results show the full dependency chain for the selected object.Right-click any result to navigate further upstream or downstream.
7. Editor Integration
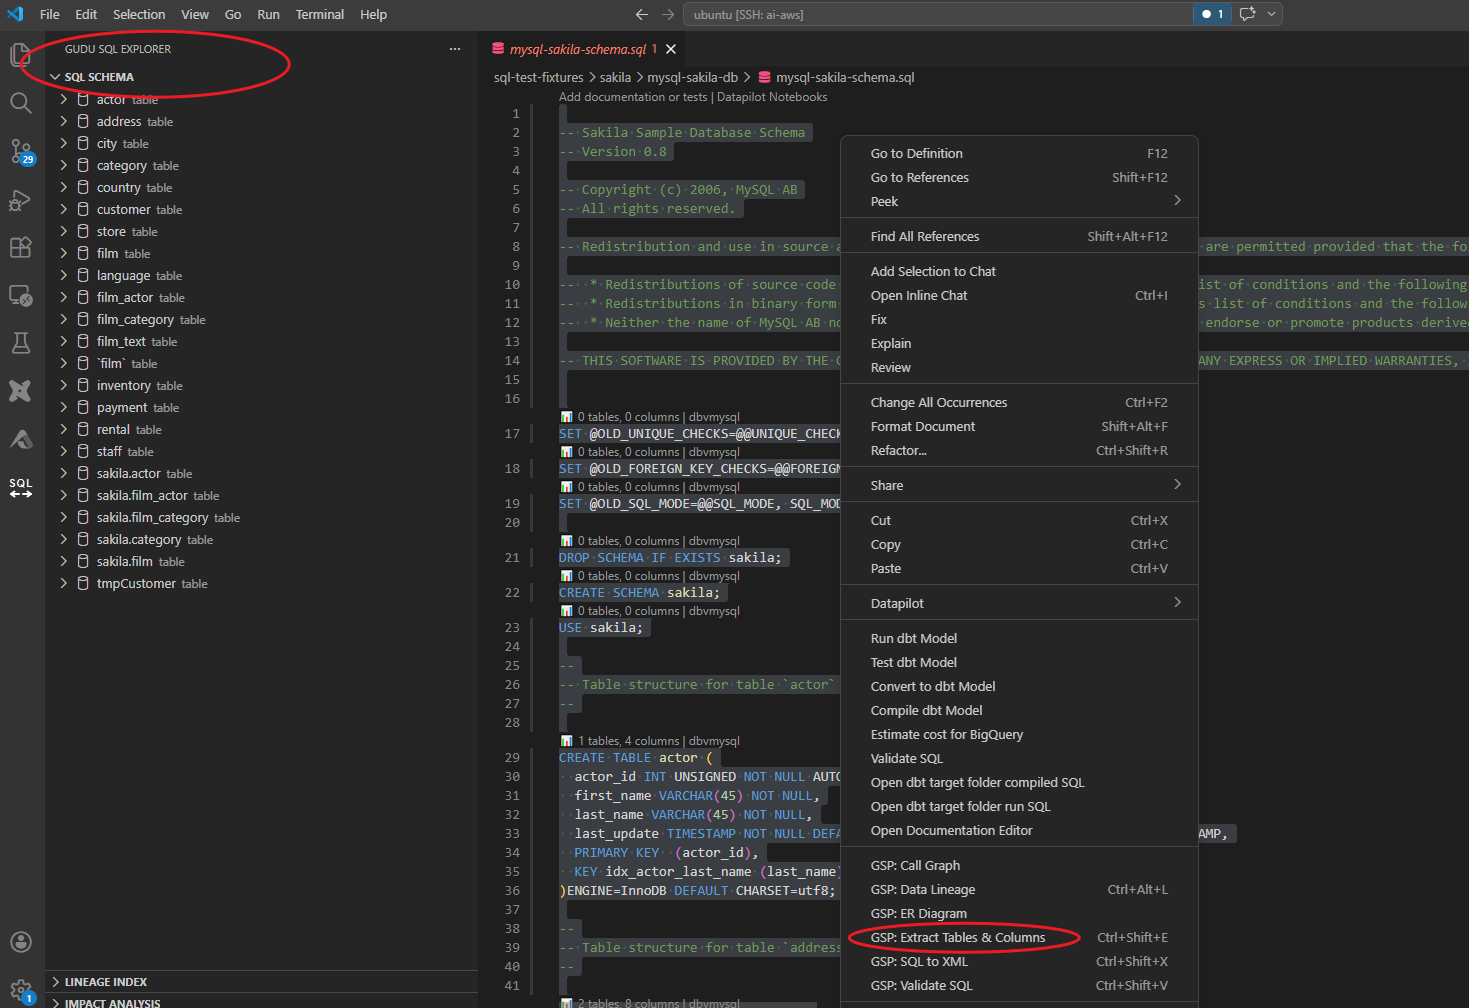
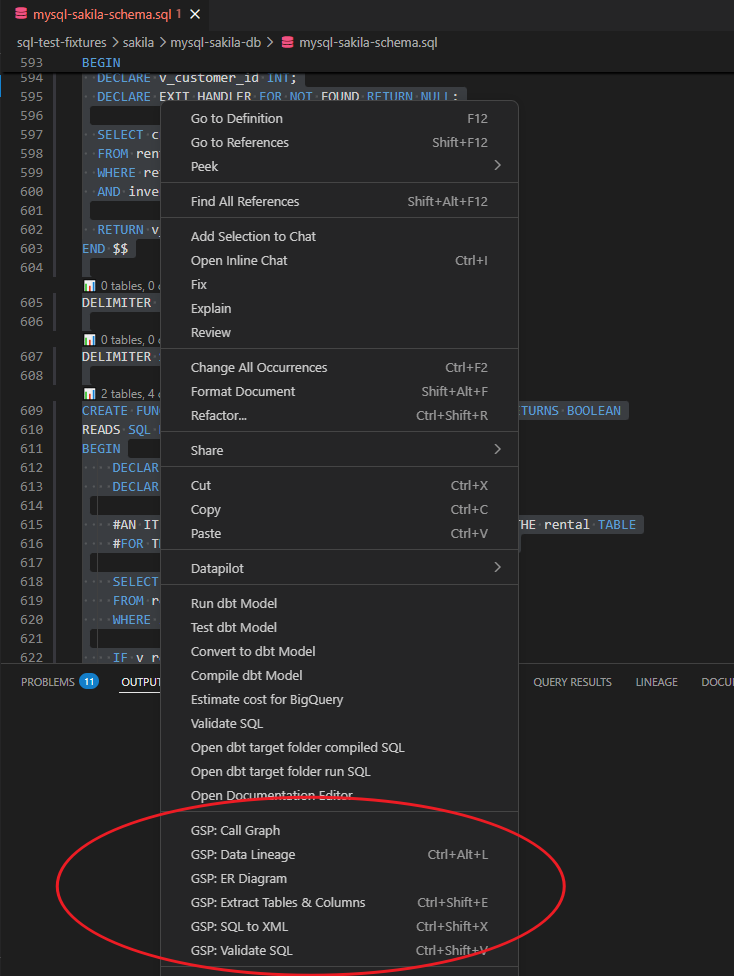
You do not need to memorize keyboard shortcuts. Every major command is available from the editor right-click menu.
Editor Context Menu
Right-click inside any .sql file to see the GSP: commands:
GSP: Validate SQL (Ctrl+Shift+V)
GSP: Extract Tables & Columns (Ctrl+Shift+E)
GSP: SQL to XML (Ctrl+Shift+X)
GSP: Data Lineage (Ctrl+Alt+L)
GSP: ER Diagram
GSP: Call Graph
All major commands appear in the editor context menu with a GSP: prefix.
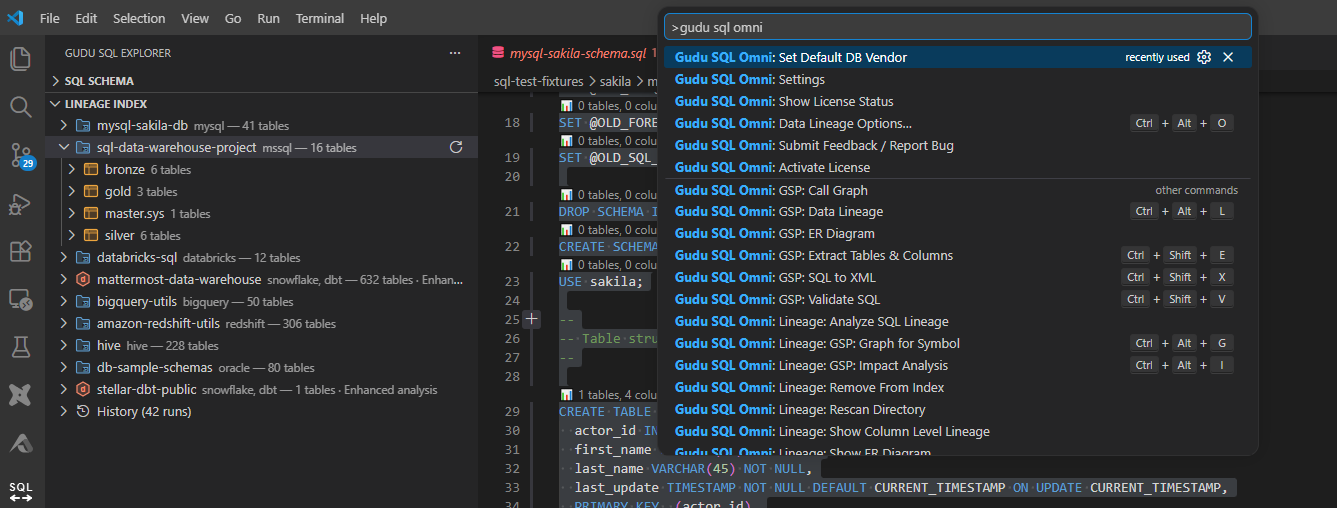
Command Palette
All commands are also available through the Command Palette (Ctrl+Shift+P / Cmd+Shift+P). Type GSP to filter the list.
Type "GSP" in the Command Palette to see every available command.
8. All Keyboard Shortcuts
Command
Windows / Linux
macOS
Validate SQL
Ctrl+Shift+V
Cmd+Shift+V
Extract Tables & Columns
Ctrl+Shift+E
Cmd+Shift+E
SQL to XML
Ctrl+Shift+X
Cmd+Shift+X
Data Lineage
Ctrl+Alt+L
Cmd+Alt+L
Configure Lineage Options
Ctrl+Alt+O
Cmd+Alt+O
Impact Analysis
Ctrl+Alt+I
Cmd+Alt+I
Graph for Symbol
Ctrl+Alt+G
Cmd+Alt+G
9. Configuration
Open settings via the Command Palette (GSP: Open Settings) or navigate to Settings > Extensions > Gudu SQL Omni.
Send anonymous error reports to help improve the extension
true
CodeLens Enabled
Show inline table/column counts above SQL statements
true
Show Temporary Results
Include intermediate/temporary tables in lineage
false
Show Restrict/Group Relations
Include restrict and group-by relations in lineage
false
Query Depth
Maximum depth for upstream/downstream queries (1-20)
5
ER Diagram Enabled
Enable ER diagram features
true
CodeLens
When enabled, CodeLens displays table and column counts directly above each SQL statement in the editor. This gives you a quick inventory without running any command. Toggle it via GSP: Toggle CodeLens in the Command Palette or in settings.
10. License Management
Gudu SQL Omni works in free trial mode out of the box. The trial allows analysis of SQL with up to 10 tables. The Personal license ($10/month) supports up to 1,000 tables and 10,000 relationships. The Professional license ($100/month) removes all limits and includes dedicated email support.
Trial Mode
All features are available.
Table limit: 10 tables per analysis.
Relationship limit: 100 relationships per analysis.
No time limit on the trial.
Activate a License
Open the Command Palette (Ctrl+Shift+P / Cmd+Shift+P).
Type GSP: Activate License and select it.
Enter your license key in the activation panel.
The extension validates the key and unlocks full functionality.
Check License Status
Run GSP: Show License Status from the Command Palette to see your current license state, expiration date, and table limit.
Clear License
Run GSP: Clear License to remove the current license and return to trial mode.
11. Power User Tips
Use the context menu for speed
Right-click in the editor to access all commands without opening the Command Palette. This is the fastest way to switch between validation, lineage, and ER diagrams.
Set your dialect once, forget it
The default DB vendor setting persists across sessions. If you work with one database platform most of the time, set it once and let auto-detection handle the exceptions.
Scan at the project root
When scanning directories, point the scan at your project root to capture cross-file dependencies. The scanner handles subdirectories recursively.
Export diagrams for documentation
Both lineage and ER diagrams support PNG export. Use this to embed diagrams in wikis, PRDs, or architecture docs without maintaining a separate diagramming tool.
Chain lineage with upstream/downstream queries
After running a lineage analysis, use the upstream/downstream query feature to trace dependencies beyond the current file. This is particularly useful for multi-file ETL pipelines.
Keep CodeLens on during code review
The inline table and column counts give reviewers immediate visibility into what each statement touches, making SQL code reviews faster and more thorough.
12. Troubleshooting
Problem
Cause
Solution
Extension does not activate
File is not a .sql file
Rename to .sql or set the file language to SQL (bottom-right status bar)
"Bundled JRE not found"
Platform-specific JRE missing from extension
Reinstall the extension; contact support if the issue persists
"Server jar not found"
Language server JAR missing
Reinstall the extension
Server fails to start
Java compatibility issue
Check the Output panel (SQL LSP Minimal) for error details
Validation shows false errors
Wrong SQL dialect selected
Set the correct dialect via GSP: Set Default DB Vendor
Lineage diagram is empty
SQL has no data flow (e.g., DDL only)
Use SELECT, INSERT, or CREATE AS SELECT statements for lineage
"Table limit exceeded"
Trial or Personal plan restriction
Upgrade your license to increase the table limit (Personal: 1,000 tables, Professional: unlimited)
Slow scanning on large projects
Many SQL files being parsed
This is expected for very large projects; the scan runs in the background
Diagrams not rendering
Webview blocked by VS Code security
Check that the extension has webview permissions; restart VS Code
If you encounter an issue not listed here, use GSP: Submit Feedback from the Command Palette to send a bug report directly to the development team.
Ready to try it?
Install Gudu SQL Omni, open a SQL file, and see your data lineage in seconds -- no cloud, no setup, no risk.